Easy access from your any device !
Useful for business trips and travel plans
CoviDraw 2.0
Sorry !
English Version not available
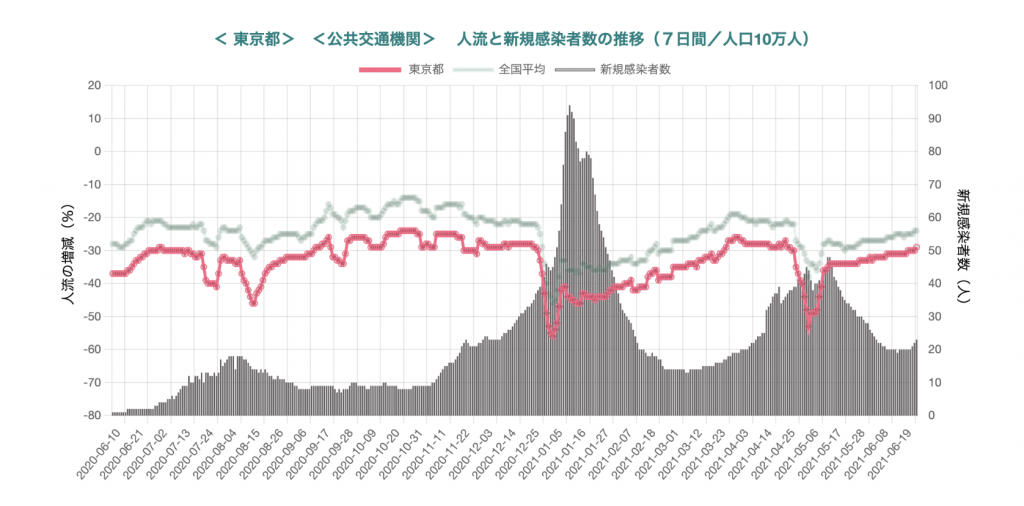
Correlation analysis tool
between movement of people and the number of covid-19 cases
Live Data analysis provided by Google / TM Software
Features
CoviDraw is a support tool for analyzing the correlation between the movement of people and the number of people infected with the covid-19. People movement data is quoted from the Community Mobility Report provided by Google. The Community Mobility Report summarizes movement trends in different categories of locations by region, and this software cites increments and decrements. This is a numerical value comparing mobility (number of visits and length of stay) with the standard value for each day of the week, and is indicated by a positive or negative rate of increase or decrease. The number of infected people is quoted in real time from the API provided by TM Software Inc. (Https://corona.tmsoftwareinc.com/api.html) It is possible to analyze the causal relationship of infection due to various environments and conditions.